

Machine learning has grown in popularity due to its ability to pull insight from both structured (think spreadsheet or Pandas) and unstructured (image, video, voice and everything else) data, and use this learned insight on new, previously unseen data. In this article, we will be loading and inspecting a structured dataset using TFX.
TensorFlow Data Validation
TensorFlow Transform (or TFX) is the production-focused set of components which allow setting up end-to-end ML tasks. TensorFlow Data Validation or TFDV is used to identify anomalies between training and serving data. Your training data is that which is used to initially set your model parameters (by gradient descent or some other method), whilst serving data is that which is presented to your model in production.
Package Requirements
Before we get started, you will need to have the following packages installed:
- Pandas - the most popular, open-source data analysis and manipulation tool built in Python
- TensorFlow Data Validation - the focus of this tutorial, used to compute descriptive statistics and detect data anomalies (among other, production-focused tasks)
The following commands will allow you to install these packages via pip:
pip install tensorflow-data-validation
pip install pandas
The following imports then allow you to import the packages installed above.
import tensorflow as tf
import tensorflow_data_validation as tfdv
import pandas as pd
Visualising Dataset Statistics
Before TFDV, the common method to find basic statistics for your structured data was via the describe() method. To display null value counts, another function .isna().sum() would be called. After this, custom functions would then be used to graph the distribution of your data and perform basic statistical analysis.
TensorFlow Data Validation handles all these functions in two lines of code. The first line generates an object with statistics for your data (more specifically it returns a DatasetFeatureStatisticsList object). Concretely, the following function takes a Pandas dataframe and generates the stats object for the dataframe passed in
stats = tfdv.generate_statistics_from_dataframe(df)
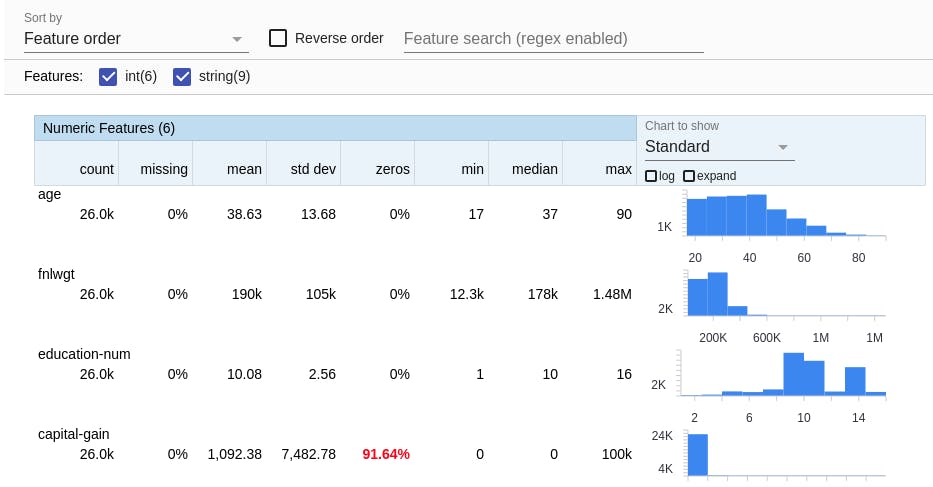
This stats object is then passed to TFDV's visualise_statisstics function, which generates a GUI directly in your Jupyter notebook showing common characteristics of your dataframe.
tfdv.visualize_statistics(stats)
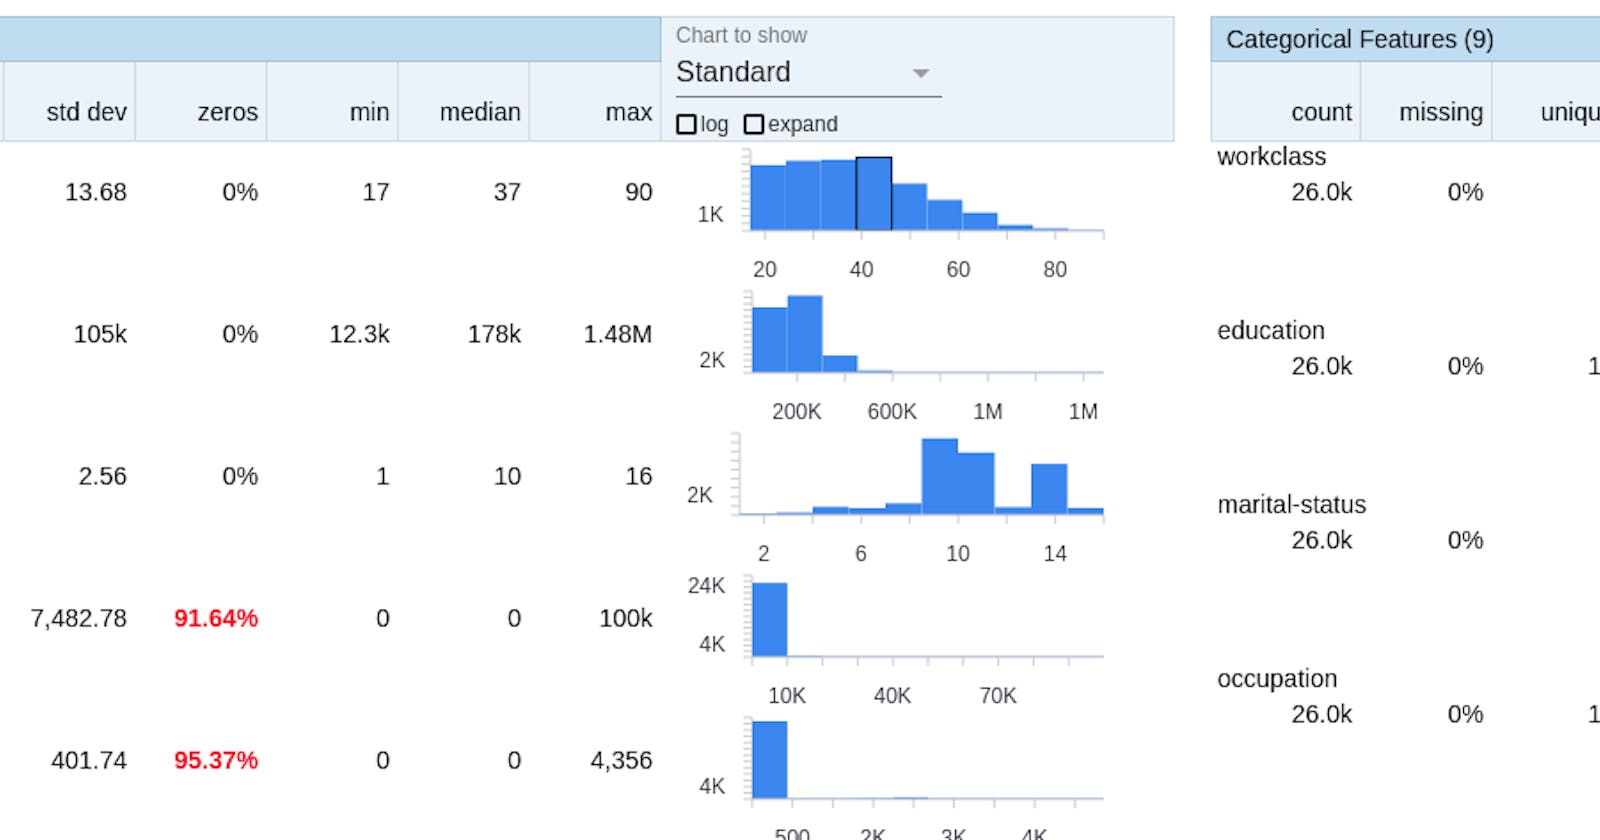
The output of the above function is shown below for a dataset, we can sort by Feature order, Amount missing or Alphabetical, and the histogram for each feature is shown on the side. The other typical characteristics (min, median, max, etc) are also displayed per attribute.
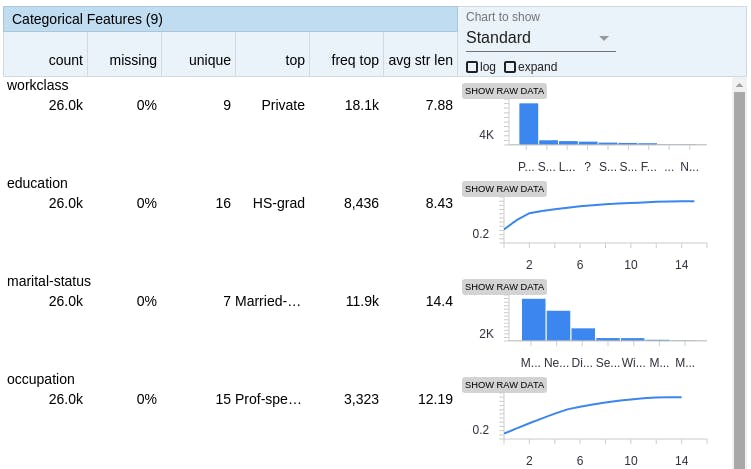
For categorical features, the displayed output is slightly different to accommodate the discrete nature of the column values. The number of unique column values, along with the top (most frequent) value, number missing and histograms are also displayed.
The GUI above provides straightforward analysis of a structured dataset, which allows you to get a better feel of your data before doing any advanced analysis. In the next article, we will validate your training data against your test data using more functions in the TFX suite of libraries.
References
Dataset used - UCI Census Income